Spectastiq: a web component for exploring audio spectrograms
An outline of some of the architectural decisions made during the development of Spectastiq, a standalone web component that allows the exploration of pre-recorded audio in frequency space inside your web browser.
Visit here to play with Spectastiq and see what it can do.
Background
Spectastiq began life as a command‑line utility that batch‑processes
.wav files from DOC AR4 and AudioMoth acoustic recorders
into uniformly styled spectrogram images. These images are then
displayed in KiwiViz, a
visualisation tool for kiwi calls (of individual kiwi!) at the
Atarau Sanctuary.
Building on this foundation, I evolved Spectastiq into a reusable web component that renders spectrograms directly in the browser at runtime. This was motivated by the needs of Cacophony Browse’s bird‑classification interface. (It turns out the best way to classify sounds in audio is to make it a computer vision problem).
In this workflow, expert users select and tag birdsong regions, contributing to a dataset that is used to train an AI model to automatically recognise native New Zealand birds.
Having a real-world consumer of the component was essential in helping to inform the customisation hooks that I'd expose via a JavaScript API and HTML attributes.
Design goals
Fast initial load time
A performant FFT implementation would be important, especially for that crucial initial load of the full audio spectrogram.
Touch first interactions
Pinch‑to‑zoom, panning, and other gestures must feel natural on mobile devices.
Smooth interaction
No jank or dropped frames, even on low spec hardware.
Self-contained
Multiple instances should safely co-exist on a page without interference or global state clashes.
Architecture
Access to raw PCM audio samples is needed to be able to generate a spectrogram.
For loading an audio file and turning it into a
Float32Array of PCM audio samples, Spectastiq currently
leans entirely on the browsers' built-in
WebAudio API.
A asynchronous call to
audioContext.decodeAudioData(myAudioFileBytes) is made,
and then we wait a while. This returns an AudioBuffer. Of
course you can't just play back an audio buffer silly, to do that
you need to create an AudioBufferSourceNode, assign this
decoded AudioBuffer to the
bufferNode.buffer property, and then
bufferNode.connect(audioContext.destination) (where
'destination' is your speakers). The WebAudio API
is almost universally panned, but it seems unlikely we can use
anything better anytime soon, so let's just just move on.
For a speedy startup time, the most important factor is that we can load an audio file once and then use the same data to generate a spectrogram image of that audio, as well as play it back through our speakers. There is some copying around of data involved, but the memory footprint ends up peaking around 3x the size of the decompressed PCM data.
To get a Float32Array for spectral analysis, we use the
WebAudio API again:
audioBuffer.getChannelData(0). At this time, Spectastiq
only uses a single channel to display a spectrogram, so in the case
where your audio is stereo, only the first channel will be used.
Having received this decoded audio buffer, this is where we can actually make some meaningful architectural choices.
Spectrogram rendering is achieved by performing a Fast Fourier Transform (FFT) over the samples of your audio. This is a math intensive process that is indistinguishable from magic. It will take some time to complete, so it's important to do this work off the main UI thread, otherwise the browser will become unresponsive.
There is an excellent crate called
RustFFT available for
Rust, and it's possible to compile this to WebAssembly and expose
its functionality to JavaScript using
wasm_bindgen.
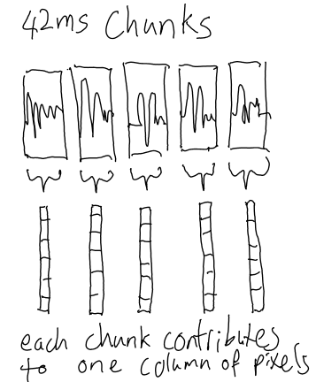
FFT takes a sequence of numeric samples of some length and returns a histogram of 'frequency buckets', which — in terms of audio — represent the intensity found in a sound at a given frequency.
If we break up our audio samples array into small chunks — let's say of 2048 samples each, or about 42ms with 48Khz audio — and perform FFT on each chunk in turn, we'll have an array-of-arrays of frequencies found in each chunk of the sound, and their corresponding intensities (approximately, how loud each frequency sounds).
This information can be interpreted as a 2D array - an image that can be displayed.
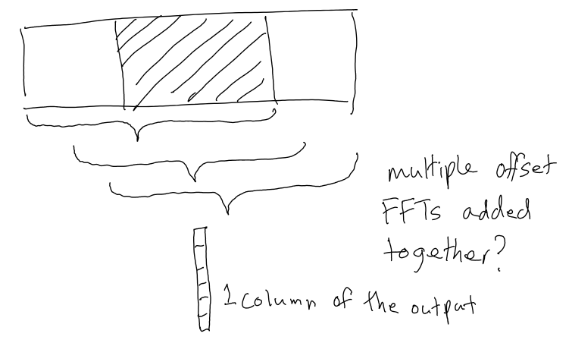
Unfortunately this nïave approach doesn't look very good. We're just not capturing enough temporal resolution.
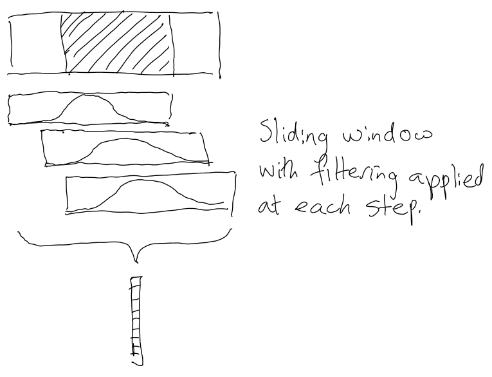
It turns out that to get a smooth looking representation of the frequencies found in a sound, it's necessary to slide a window the length of our chunk size over the audio, and for each increment where the window is moved over the sample data, take an FFT over the window and accumulate the frequency intensity data from each FFT step into a single set of buckets representing that slice - what can be thought of in our image as a vertical column of pixels. That's complicated to understand, so I've tried, (and quite possibly failed) to illustrate it here:
This still looks pretty rough. There's another step most spectrogram generating software uses to further smooth things out, and that's to apply a 'filter', or 'window function', also known as a 'kernel'. This just means that for every increment when sliding the sampling window across the data, a weighting is applied to all the values inside the window. This is usually some kind of bell-shaped distribution.
Okay, so there's some output data that corresponds to the frequency information in the audio. We can draw that into a nice image, but this is all happening on a single CPU thread, and is not as fast as it could be.
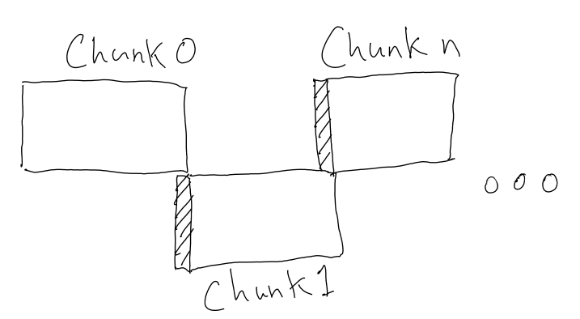
Because we have that sliding window function, each column of the spectrogram has a dependency on some sample data from a slightly earlier time-step. At the beginning of the audio, where there are no previous samples to look back at when evaluating the first one, there's a visible 'shadow' before things really get going.
Spectastiq splits up the audio into a number of slices (in Rust
parlance), and dispatches those slices to an equal number of
WebWorker threads, each running the same FFT-processing
Web Assembly module.
The tricky bit in successfully parallelising this work was that these
chunks need to be overlapping, with each chunk containing the
last WINDOW_SIZE samples from the previous chunk as a
kind of prelude to prime the FFT calculation. If we do this
successfully it prevents the early columns of pixels in each
spectrogram chunk from containing that ugly shadow discontinuity. When
each worker returns the processed frequency data, this initial prelude
is not included.
In Spectastics' implementation, FFT WINDOW_SIZE is
always 2048 samples, but this may become customisable in the future.
For now 2048 samples gives a reasonable trade-off between temporal
resolution of the audio vs how fine-grained the frequency buckets are.
Rendering
After all of the worker threads have returned, and there's a new spectrogram buffer available, it needs to be rendered to the screen.
Substituting intermediate placeholder images
When the user zooms and pans around the audio file, Spectastiq aims to have those interactions happen at your devices' full native frame rate.
While awaiting delivery of a new higher definition spectrogram image for the current time-range of audio you're viewing, Spectastiq draws the appropriate section using the best resolution previous image that it has, as a placeholder until the new sharp image is ready to be swapped in.
At the limit, this image is a portion of the spectrogram image of the entire audio clip that was rendered at initialisation time.
Because of this design decision, when a user is panning or zooming the spectrogram the image may appear momentarily blurry, but it makes for a more responsive user experience overall.
Drawing to a canvas
One could decide to use a basic HTML <canvas> with
a "2d" context and employ the
drawImage API to 'blit' a portion of your
spectrogram image buffer, stretched out to cover the visible area. An
early version of Spectastiq did in fact use this method, but
I discovered an (under-specified?) limitation to this API at higher
zoom levels.
canvasContext.drawImage() rounding issues
drawImage as implemented by browsers doesn't support
cropping to sub-pixel offsets for the rectangular portion you're
drawing. When calling something like
drawImage(imageBufferSource, 2.5, 0, 10.5, sourceHeight, 0, 0,
            targetWidth, targetHeight)
, those fractional values on the x-axis are going to get clamped.
In practice this means that you'll often experience a jarring 'popping' effect when the high resolution image eventually replaced the low resolution placeholder cropped version.
The placeholder would be offset slightly in x from the spectrogram data that actually represented that time range, with the effect growing more noticeable the more you're cropping into your placeholder source.
WebGL2 context
The "webgl2" context provided by HTML canvas
doesn't share this limitation.
GPU texture sampling units are quite capable of doing the correct sub-pixel sampling of a texture.
The current version of Spectastiq uploads the
Float32Array buffer created by the FFT worker threads to
the GPU as-is, thanks to the ability to use floating point textures.
OES_texture_float_linear is a WebGL2 extension that is
almost universally available. It means Spectastiq doesn't need to
do work to quantize the Float32Array returned by the FFT
into 8-bit grayscale values - we can just use a single channel float32
texture and do all that work in a glsl shader, taking
advantage of GPU parallelism.
That same shader can also cheaply map our float values to an RGB colour gradient texture. In the canvas 2d version of this, we needed to reference a lookup table for each pixel we output.
A final additional benefit of this approach: when drawing the spectrogram at a lower resolution than the backing texture, the GPUs' texel sampler gives us smooth interpolation between values for free.
Removing jank
Initial versions of Spectastiq had the 'minimap' timeline range selector background drawn to a separate canvas.
The 'grabby handles' and draggable playhead indicators were contained inside DOM elements that were manipulated with CSS.
This strategy worked well on desktop, but introduced unacceptable jank on my low spec reference device due to reflows and repaints when dragging the slider handles.
I was unable to completely eliminate this DOM overhead, even when forcing Chrome to promote these elements to GPU accelerated layers using CSS tricks.
Ultimately I was able to remove all the frame hitches when interacting with the spectrogram by drawing all the UI onto a 2d canvas layer above the spectrogram WebGL canvas, and handling all interaction hit-testing of UI elements myself.
I'm not thrilled about this. It sacrifices any accessibility that might have previously been available. I ultimately decided the performance gains were necessary in this instance.
Memory copy overhead in typical operation
In normal Spectastiq usage, there's a decent amount of copying of
data between all of these WebWorker threads. On modern
desktop systems, this doesn't really have a noticeable impact on
the user experience.
On my reference Android hardware this is no longer the case, especially for longer audio clips.
I think the memory subsystem is just that much slower on this device
that memcpy has a non-negligible impact.
It's not a problem in terms of actual UI jank — all this work is still happening safely off the main UI thread — but it does mean that each frame of the newly rendered spectrogram takes a while to resolve.
There is a way that we can avoid copying chunks of the decoded audio
buffer between the main UI thread and all these workers. The backing
buffers can be changed to SharedArrayBuffers, but there
are many caveats that apply when attempting this.
In order to be able to use SharedArrayBuffer, it's
necessary to be serving the page you're embedding Spectastiq in
from a
'Secure context'. This means having a valid HTTPS certificate, and having the means
to serve your page with some additional security headers present.
It's
a hassle, but has been deemed necessary to mitigate the security risks
of Spectre, Heartbleed and similar attacks.
If you are in a position where you can enable
SharedArrayBuffer support, doing so speeds up performance
on my low spec reference hardware quite dramatically.
Why roll your own FFT?
The WebAudio API does expose native FFT functionality,
but its implementation runs on a single thread.
While it should be possible to parallelise it — following the same slicing strategy I used in Spectastiq — I ultimately preferred the extra control that comes with running the FFT calculations in WebAssembly.
With WASM I have full control over the exact parameters and windowing functions of the FFT.
Prior art
The Cornell e‑Bird media library website offers a comparable way to explore birdsong spectrograms, but it makes a very different set of tradeoffs to Spectastiq.
It pre‑renders everything.
Instead of computing an FFT on the fly, e‑Bird generates a series of
JPEG spectrogram strips ahead of time, at multiple zoom levels. The
browser javascript component fetches those images and stitches them
together, aligning them with the audio timeline as you scroll or play.
This makes a lot of sense for less powerful devices, as images and audio can be downloaded in parallel by the browser.
Major cons for this approach are the need to host and run a server-side preprocessing pipeline, and additional storage requirements.
User experience is also a bit more restrictive: You can't change the colour palette the spectrograms are viewed in, and at the maximum zoom level some visual fidelity is lost due to obvious JPEG artifacting.
Future work
When Spectastiq renders long audio clips, the main thing that slows it
down is the bottleneck at decodeAudioData().
All browsers run this function on a single thread, so the whole audio file must be parsed and decoded before playback can start. It also doesn't return a stream of the decoded audio, so we can't start rendering a spectrogram eagerly. It only returns once the entire file has been decoded.
There's no technical reason why you couldn't break the file into pieces and decode those pieces in parallel — it's just fiddly.
Most browser‑supported audio formats (MP3, AAC, Opus, etc.) are streaming formats: they consist of a sequence of audio frames that are independent of one another. If you locate the nearest frame boundary in the compressed stream, you can start decoding from that point.
An approach to doing this work in parallel might look like the following:
- Split the file into equal, slightly overlapping chunks (the amount of overlap could be informed by the max length of an audio frame in a given format).
- Some format-specific parsing code would seek to the earliest audio frame header in each chunk, and then prepend a valid stream header.
-
Decode parts in parallel using
AudioWorklet, and then join them all back together. - Optionally, you could also start creating the initial spectrogram as soon as you had at least one decoded chunk, though juggling this would also introduce additional complexity.
If the network is faster than your serial decode speed, you could perhaps even download the audio file chunks concurrently using HTTP range requests.
This is all quite conceptually simple, but in practice it is probably a fair bit of work to get right.
Usage
Spectastiq is under an open source license, and is free to use and extend however you fancy.
I had fun designing and building it, so I hope it's useful,
especially to those presenting research into bird-song.
If it does end up being useful to the work you're doing, please
reach out, I'd love to hear about it!